CGM Project
To investigate the effect of popular teen beverages on blood glucose and insulin responses, and develop a color-coded glucose warning label system to educate and influence healthier choices.
Teen health is rarely addressed. This project combines public health, behavioral psychology, nutrition science, and app design using real data collection to promote metabolic health before problems develop.
Research Question:
How do commonly consumed beverages among teens impact glucose levels, and can a visual warning system effectively communicate metabolic risk?
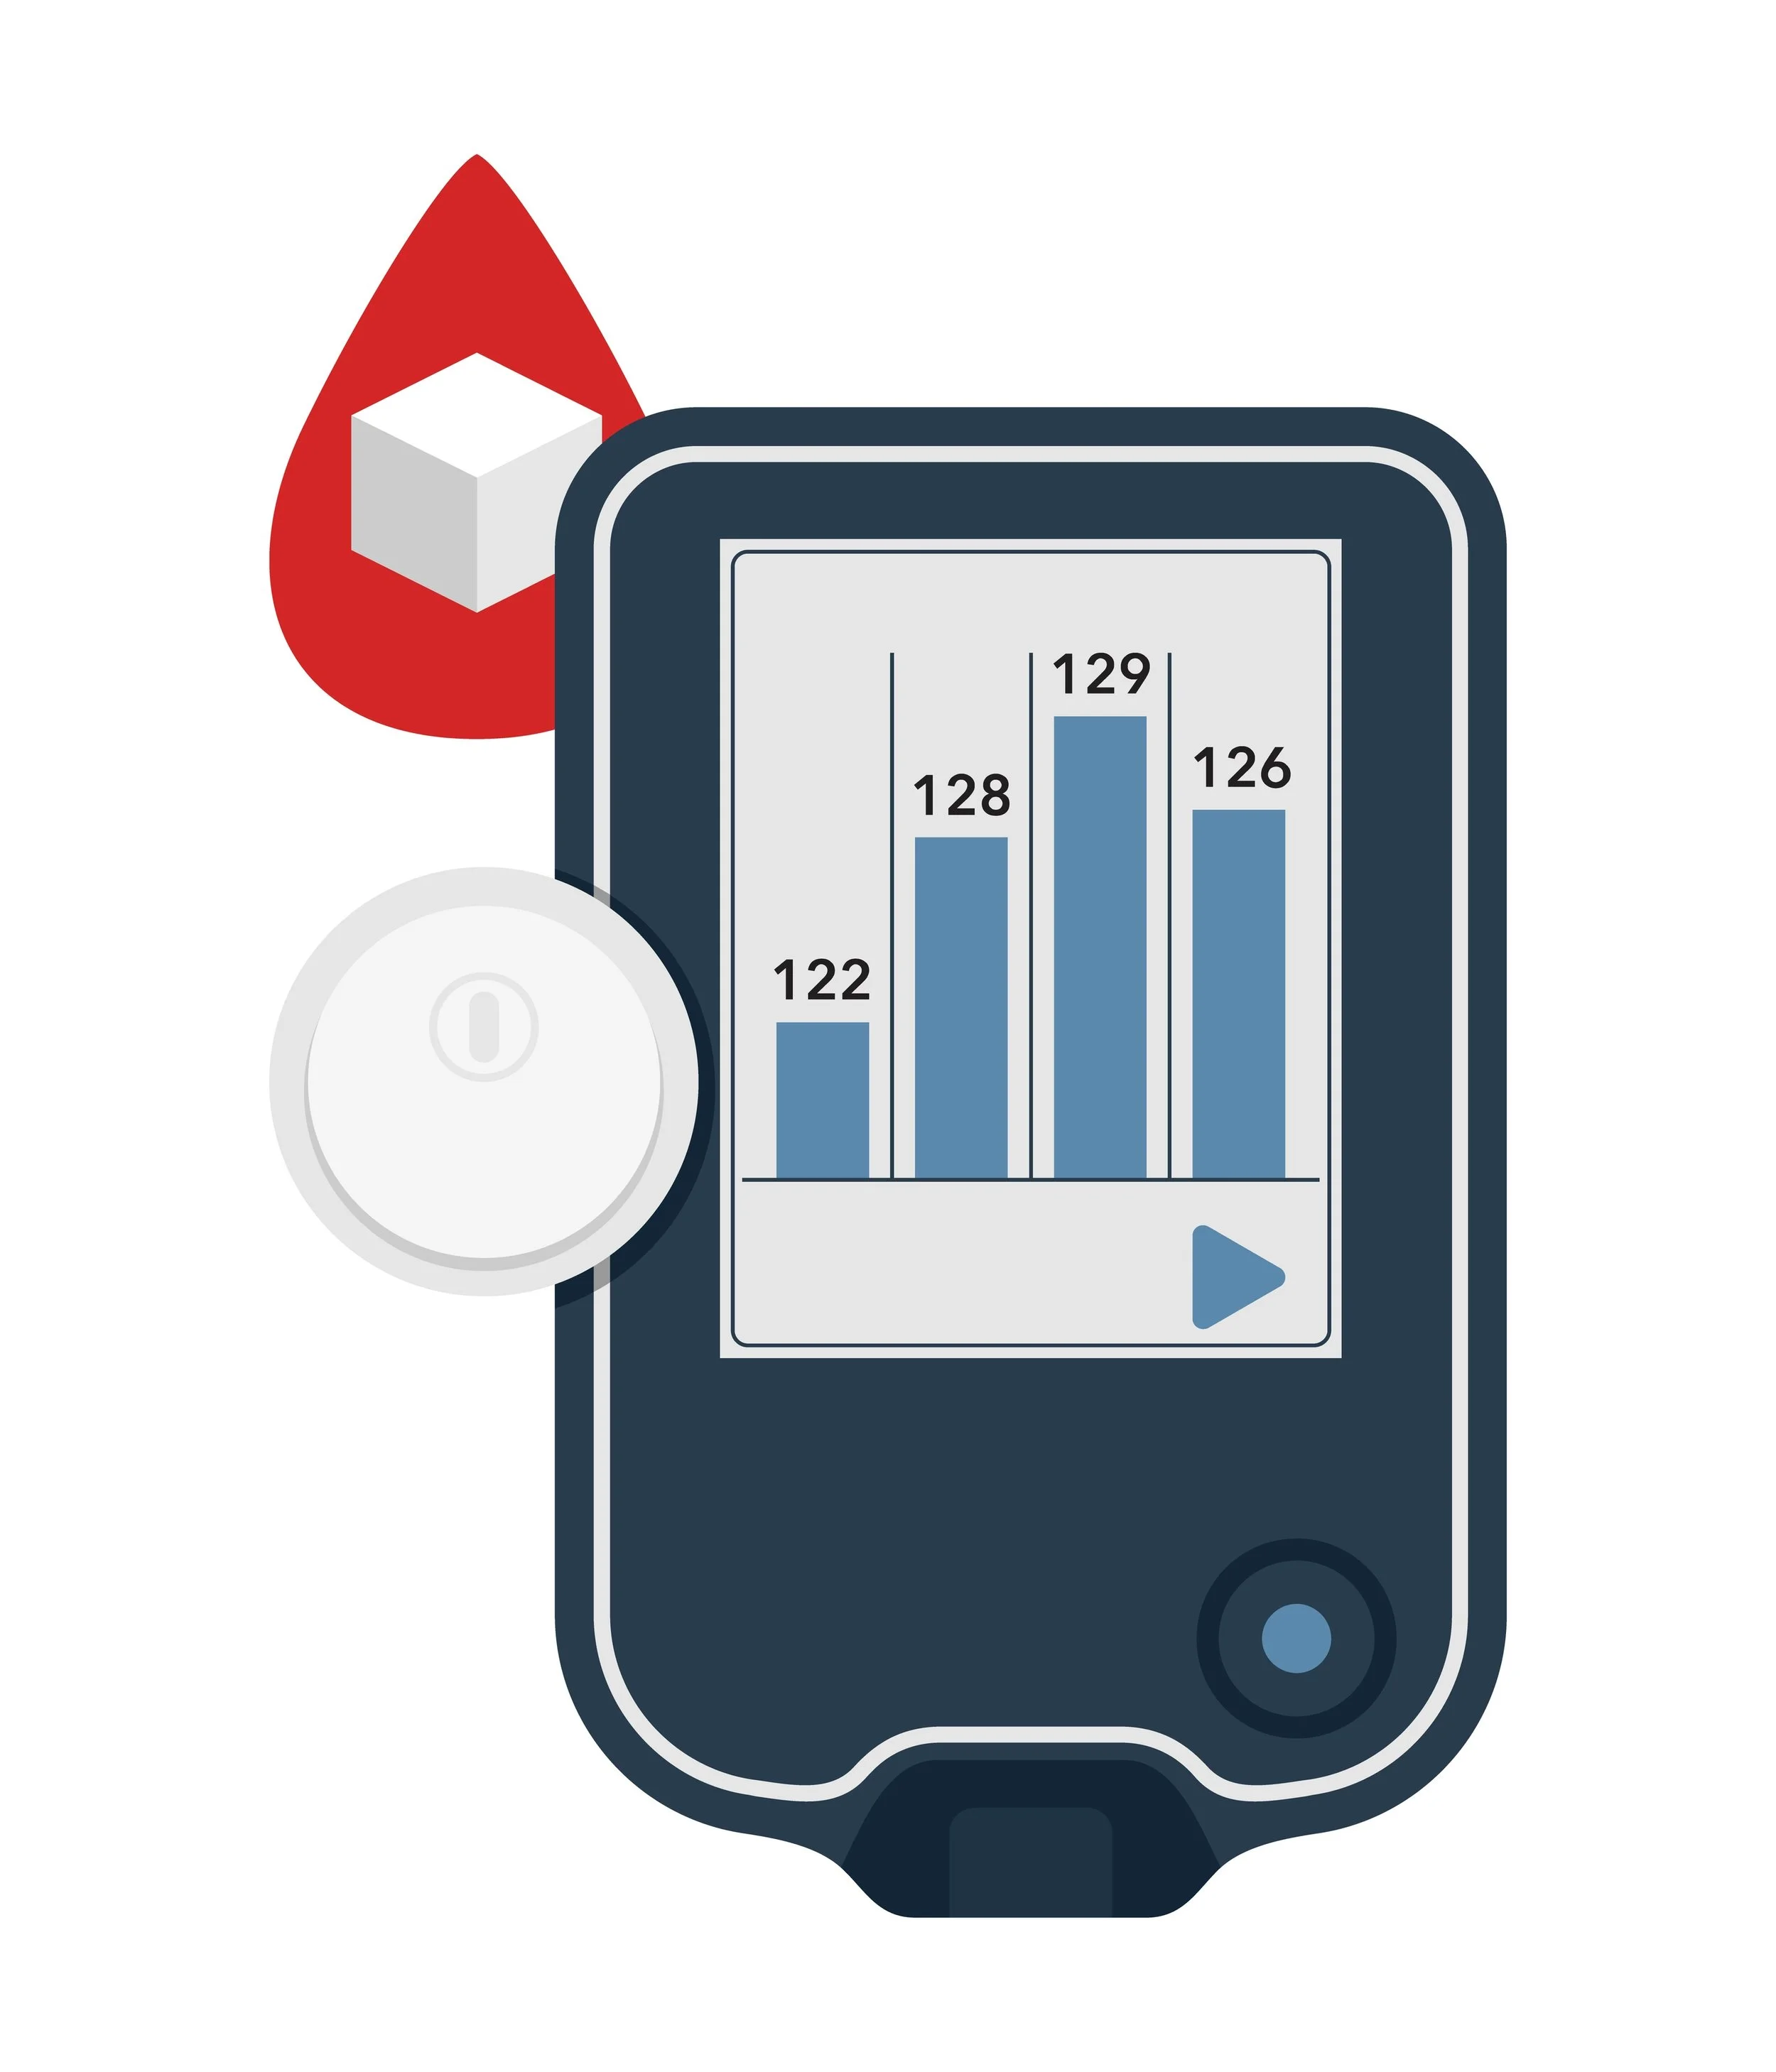
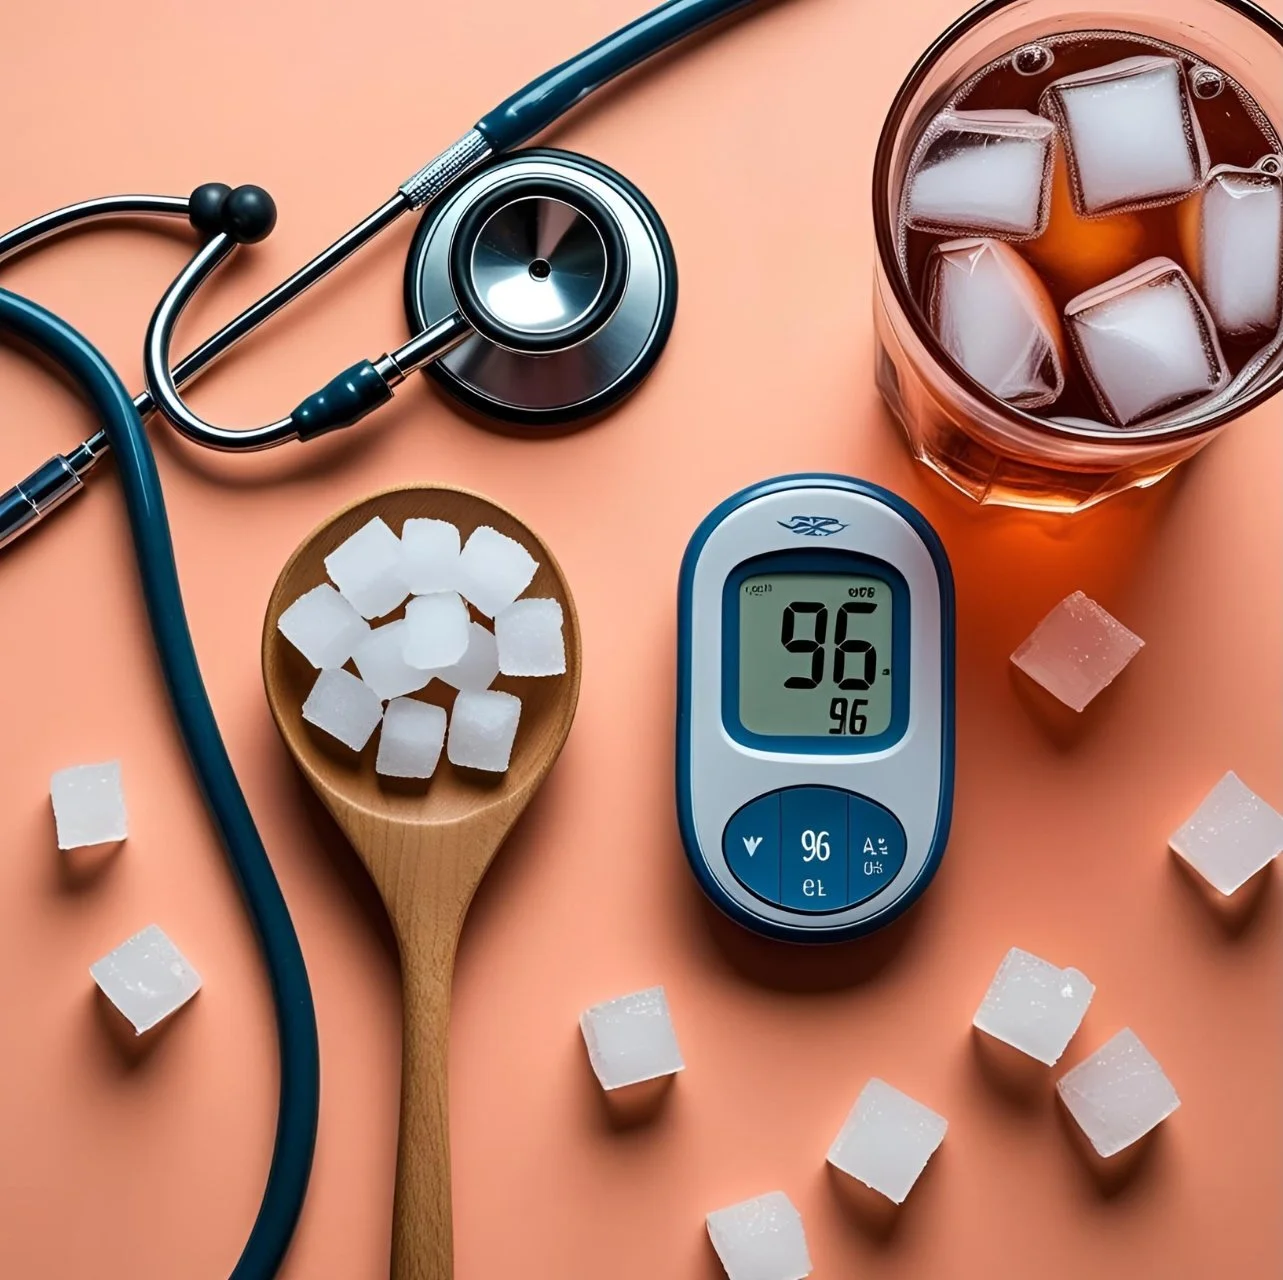
Analyze popular teen drinks (e.g., Starbucks Frappuccinos, Gatorade, soda, energy drinks, smoothies) for their glycemic load and immediate glucose response using a CGM or finger-prick tool.
Compare responses in real teens, Partner with peers to beta test the UX and show impact on awareness or behavior change
Goals
Measure post-consumption glucose and (insulin response to top 5–10 teen-favorite drinks using CGM.
Categorize drinks by glycemic impact using a color-coded warning system (green/yellow/red).
Create an app or wearable that can track and help monitor blood glucose levels with beverage consumption.
Raise awareness and promote informed decision-making via an educational campaign.
Hypothesis
Drinks high in added sugars or refined carbohydrates will cause rapid glucose spikes, which can be simplified and visualized using a color-coded system that encourages healthier choices.
Methodology
Drinks high in added sugars or refined carbohydrates will cause rapid glucose spikes, which can be simplified and visualized using a color-coded system that encourages healthier choices.
1. Beverage Selection
Survey 50–100 teens (anonymously, online or at school) to identify the top 5–10 most consumed beverages. Examples may include:
Starbucks Frappuccino
Boba/bubble tea
Energy drinks (e.g., Celsius, Monster)
Gatorade/Powerade
Fruit smoothies (store-bought)
Iced tea
Soda (e.g., Coke, Sprite)
2. Nutritional Analysis
Gather nutritional data for each drink:
Sugar content (grams)
Carbohydrates (grams)
Total calories
Presence of fat
Presence of fiber
Ingredients list
3. Glucose Response Testing
Use a continuous glucose monitor (CGM) or glucometer to test volunteers’ glucose response over 2 hours after consuming each drink on separate days (fasted baseline → drink → test at 15, 30, 60, 90, 120 min).
Record peak glucose
Time to return to baseline
Area Under Curve (AUC) if possible
We will compare to published glycemic index (GI) and glycemic load (GL) estimates for each drink from literature.
4. Insulin Data
Literature review of insulin index of sugary drinks.
Published data on insulin spikes related to glycemic load in adolescents.
| Drink | Sugar (g) | Glucose Peak | Time to Return | Score | Label |
|---|---|---|---|---|---|
| Sprite (12 oz) | 44g | +65 mg/dL | 2 hr | 82 | 🔴 |
| Bubble Tea (16 oz) | 36g | +58 mg/dL | 1.5 hr | 73 | 🔴 |
| Fresh Fruit Smoothie (12 oz) | 18g | +35 mg/dL | 1 hr | 52 | 🟡 |
| Protein Shake (low sugar) | 4g | +12 mg/dL | 45 min | 28 | 🟢 |
| Sweetened Iced Tea (12 oz) | 32g | +50 mg/dL | 1.5 hr | 68 | 🔴 |
| Fruit Punch (12 oz) | 40g | +60 mg/dL | 2 hr | 79 | 🔴 |
| Regular Soda (Coke, 12 oz) | 39g | +62 mg/dL | 2 hr | 80 | 🔴 |
| Sports Drink (Gatorade, 12 oz) | 34g | +48 mg/dL | 1.5 hr | 65 | 🔴 |
| Chocolate Milk (8 oz) | 24g | +40 mg/dL | 1.25 hr | 60 | 🟡 |
| Flavored Coffee Drink (12 oz) | 28g | +42 mg/dL | 1.25 hr | 63 | 🟡 |
| Unsweetened Iced Tea | 0g | +0 mg/dL | — | 10 | 🟢 |
| Water | 0g | 0 mg/dL | — | 0 | 🟢 |
- 🟢 = Low Sugar / Minimal Glucose Impact
- 🟡 = Moderate Sugar / Medium Glucose Impact
- 🔴 = High Sugar / High Glucose Spike